INTRODUCTION
The size and density of a population are fundamental ecological characteristics that influence the extent of competition for resources between individuals and interactions with other species (Begon & Townsend 2020). Both competition and interactions can reduce the reproductive success and survival of the individuals. In addition, population size is important for the long-term existence of a population (Groome et al. 2005). A variety of techniques have been developed to estimate the population size of ground-dwelling invertebrate species (Henderson & Southwood 2016). Nevertheless, there are relatively few estimates of population size or density of individuals in natural land snail populations (Cameron 2016). The main reasons may be the hidden lifestyle of the snails and the fact that the very small, young snails can hardly be found (Cain 1983, Heller 2001). Depending on the method used and the characteristics of the species and habitat, each estimate of population size has its limitations (Oggier et al. 1998). For practical reasons, the individual density (number of individuals per unit area) is often determined, as the spatial extent of a snail population is not known. Furthermore, density estimates’ studies are frequently based only on individuals larger than a certain size; small snails are neglected (e.g., individuals of different species ≥ 5 mm in a subtropical wet forests (Alvarez & Willig 1993), ≥ 10 mm in a population of Theba pisana (O. F. Müller, 1774) in coastal dunes (Johnson 2011), and > 8 mm in populations of Arianta arbustorum (Linnaeus, 1758) in alpine grasslands and forests (Baur 1986, 1988).
Mark-release-recapture methods have been shown to be suitable for density estimates in snails with larger shells (Cameron 2016). With these methods, living snails are not removed from the habitat permanently and the habitat is only slightly disturbed. As with all other methods, mark-release-recapture methods make assumptions that are not always met (Begon 1979, Henderson & Southwood 2016). However, as a non-invasive method, mark-release-recapture is likely to be the best approach for density estimates of threatened snail species with large shells in nature reserves. We used a mark-relase-recapture method to estimate the population density of Pomatias elegans (O. F. Müller, 1774) in a protected beech forest in north-western Switzerland over 15 years (Fig. 1). To date there are no detailed data on the population density of P. elegans in Western Europe.
Fig. 1
As a caenogastropod, Pomatias elegans has a calcareous operculum that fits tightly to the shell opening when the animal is retracted
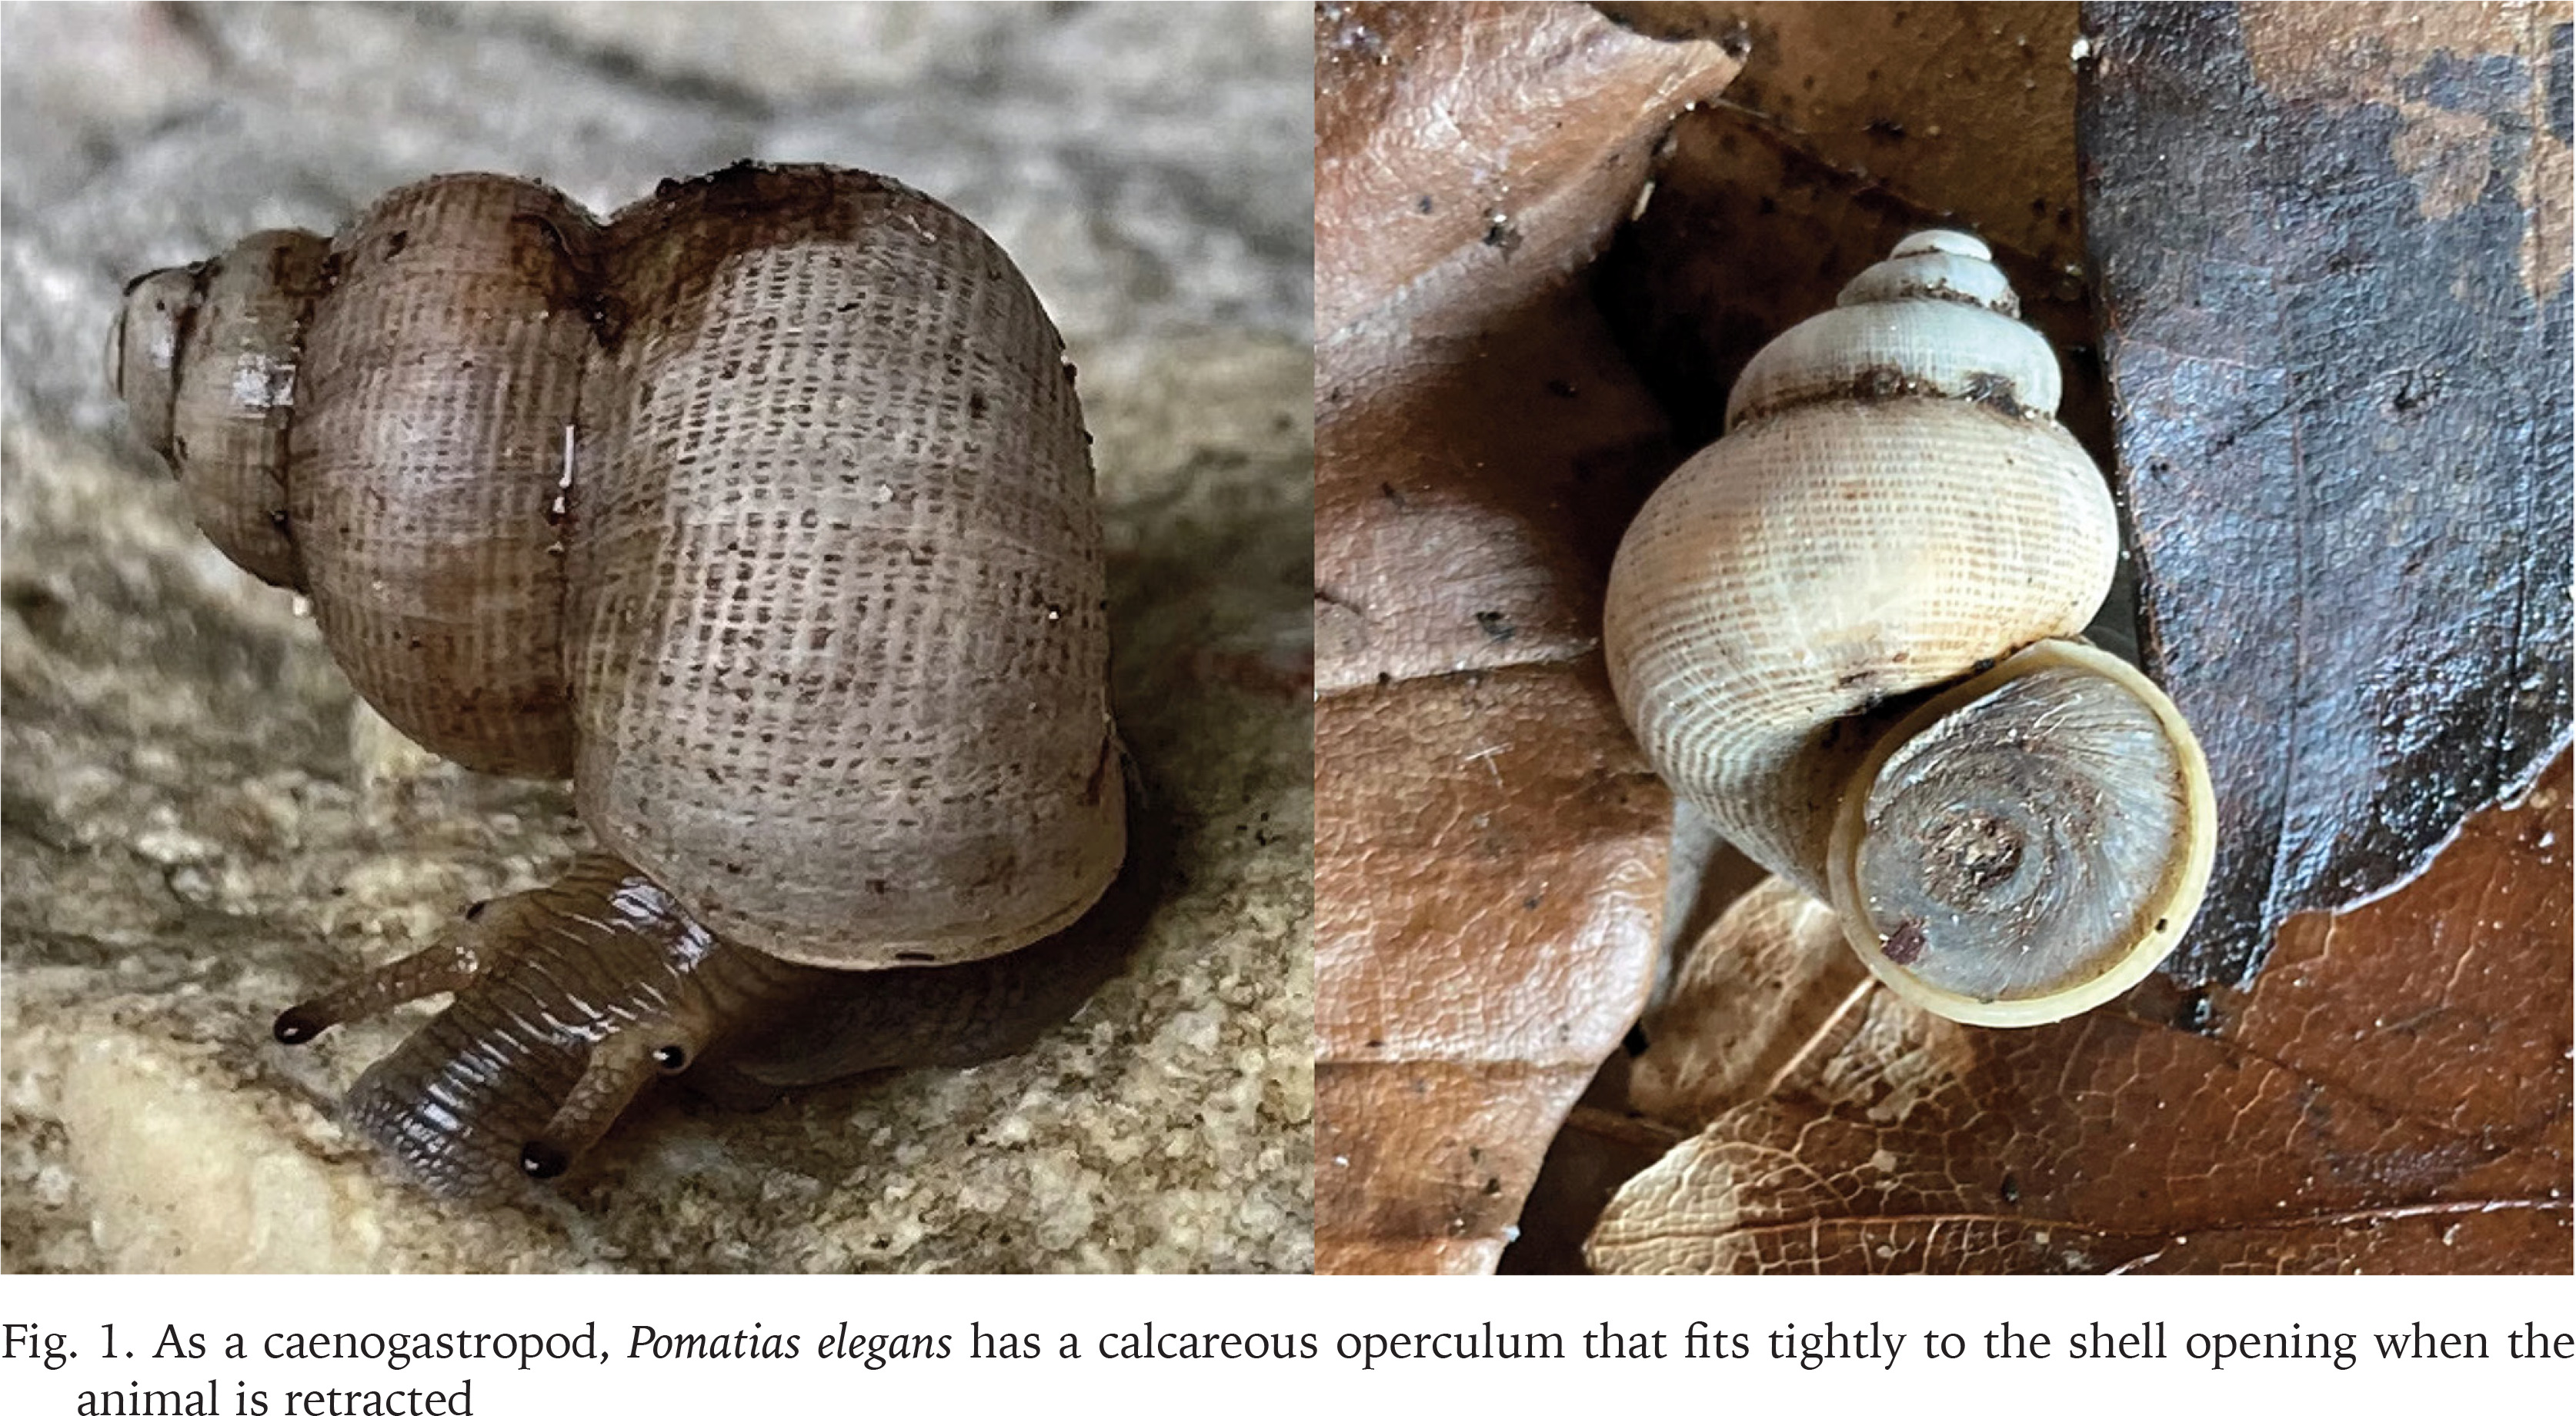
Pomatias elegans is a Mediterranean and West European land snail common in Southern Europe (Kerney & Cameron 1979). The species is a caenogastropod and reaches its northern limits in the British Isles, Belgium, and the central and southern parts of Germany, where it has a scattered distribution and most populations are isolated (Kerney & Cameron 1979, Kerney 1999). Isolated populations also occur in Ireland and Denmark (Kerney 1999). The population we studied is located at the eastern limit of the species’ range (Kerney & Cameron 1979). Pomatias elegans is a strictly calcicole species that lives on limestone rocks, calcareous soils and coastal shell sands (Kerney & Cameron 1979). It occurs in open woods, copses, forest edges and vineyards with loose soils in which the snails can burrow during periods of drought and hibernate during winter (Fechter & Falkner 1990). The species is gonochoristic (Kerney & Cameron 1979).
Pomatias elegans feeds primarily on leaf litter and other dead plant material. Mating pairs can be observed in the summer months (Kilian 1951). In autumn, females lay individual spherical eggs 2 mm in diameter after being coated with mucus (Creek 1951). The slowly hardening mucus causes soil crumbs and stones to stick to the surface of the egg. This makes it difficult to find the eggs and protects them from drying out, predators and fungal attack (Baur 1994). It is not known how many eggs a female produces per year (or per lifetime). Juveniles that hatch from the egg have a shell height of 2 mm. Individuals of P. elegans become sexually mature in the third year of life and reach an age of 4–6 years (Kilian 1951, Fechter & Falkner 1990). The cone-shaped shell of adults is 12–15 mm high and 9–11 mm wide (Kerney & Cameron 1979).
The survival of P. elegans populations is affected by (1) the poor ability of snails to colonise and recolonise suitable habitats, and (2) the shrinking total area of suitable habitat in northwestern Europe due to habitat destruction, intensified farming and pesticide use (Kerney 1999, Jordaens et al. 2001). In Switzerland, P. elegans is included on the Red List as vulnerable (Rüetschi et al. 2012), while it is critically endangered in Ireland (Byrne et al. 2009).
Long-term studies of populations provide a baseline for understanding temporal variation in population dynamics and environmental change (Begon & Townsend 2020). Using long-term studies, we can also investigate whether changing habitat characteristics have an influence on the population density of the target species. In the forest studied, the cover and thickness of the leaf litter layer is the main food source for P. elegans and at the same time the microhabitat in which the snails live (Kilian 1951). The shrub cover provides shade which in turn retains moisture in the leaf litter layer. To examine whether population density is influenced by leaf litter characteristics and shrub cover, we recorded these habitat characteristics at the same site every year.
Changing habitat characteristics and prevailing weather conditions can also alter the size distribution of the P. elegans population. Since P. elegans has indeterminate shell growth, the size distribution of the snails also reflects partially their age distribution. However, it is not yet known how the shell growth proceeds in large snails (adult animals that reproduce). We expect that shell growth is greatly reduced in reproducing snails because a significant amount of energy is invested in reproduction as shown in other land snails (Baur 1989, Cameron 2016). We were able to record individual shell growth over three periods of a year in snails of different size that had already been marked the previous year. These growth patterns could be analysed in relation to the shell size of the individuals and for different years. A significant change in individual shell growth can be considered as the beginning of reproductive activity.
In particular, we asked the following questions:
MATERIAL AND METHODS
FIELD SURVEY
The study was conducted in the Wartenberg nature reserve, 7 km east of the centre of Basel, Switzerland (47.5211°N, 7.6550°E). The north-west facing slope of this forest reserve is dominated by beech trees (Fagus sylvatica) and harbours a large population of P. elegans relatively uniformly distributed over an area of approximately 250 m × 100 m (Fig. 2). The population is isolated and located at the southeastern edge of the species’ range. The soil in the study area is a Haplic Luvisol with a characterised thick humic Ah horizon containing fragments of limestone and carbonate concretions and the underlying bedrock is limestone (Walthert et al. 2004). Total annual precipitation averages 842 mm and annual mean temperature is 10.9 °C in Basel (records from 1991 to 2020; MeteoSwiss 2024).
Fig. 2
Habitat of Pomatias elegans at the study site in the Wartenberg nature reserve near Basel, Switzerland and schematic of the grid with 72 1-m2 units used to record snail density in the embankment of the forest road. The snails live in the leaf litter layer, which consists mainly of Fagus sylvatica leaves
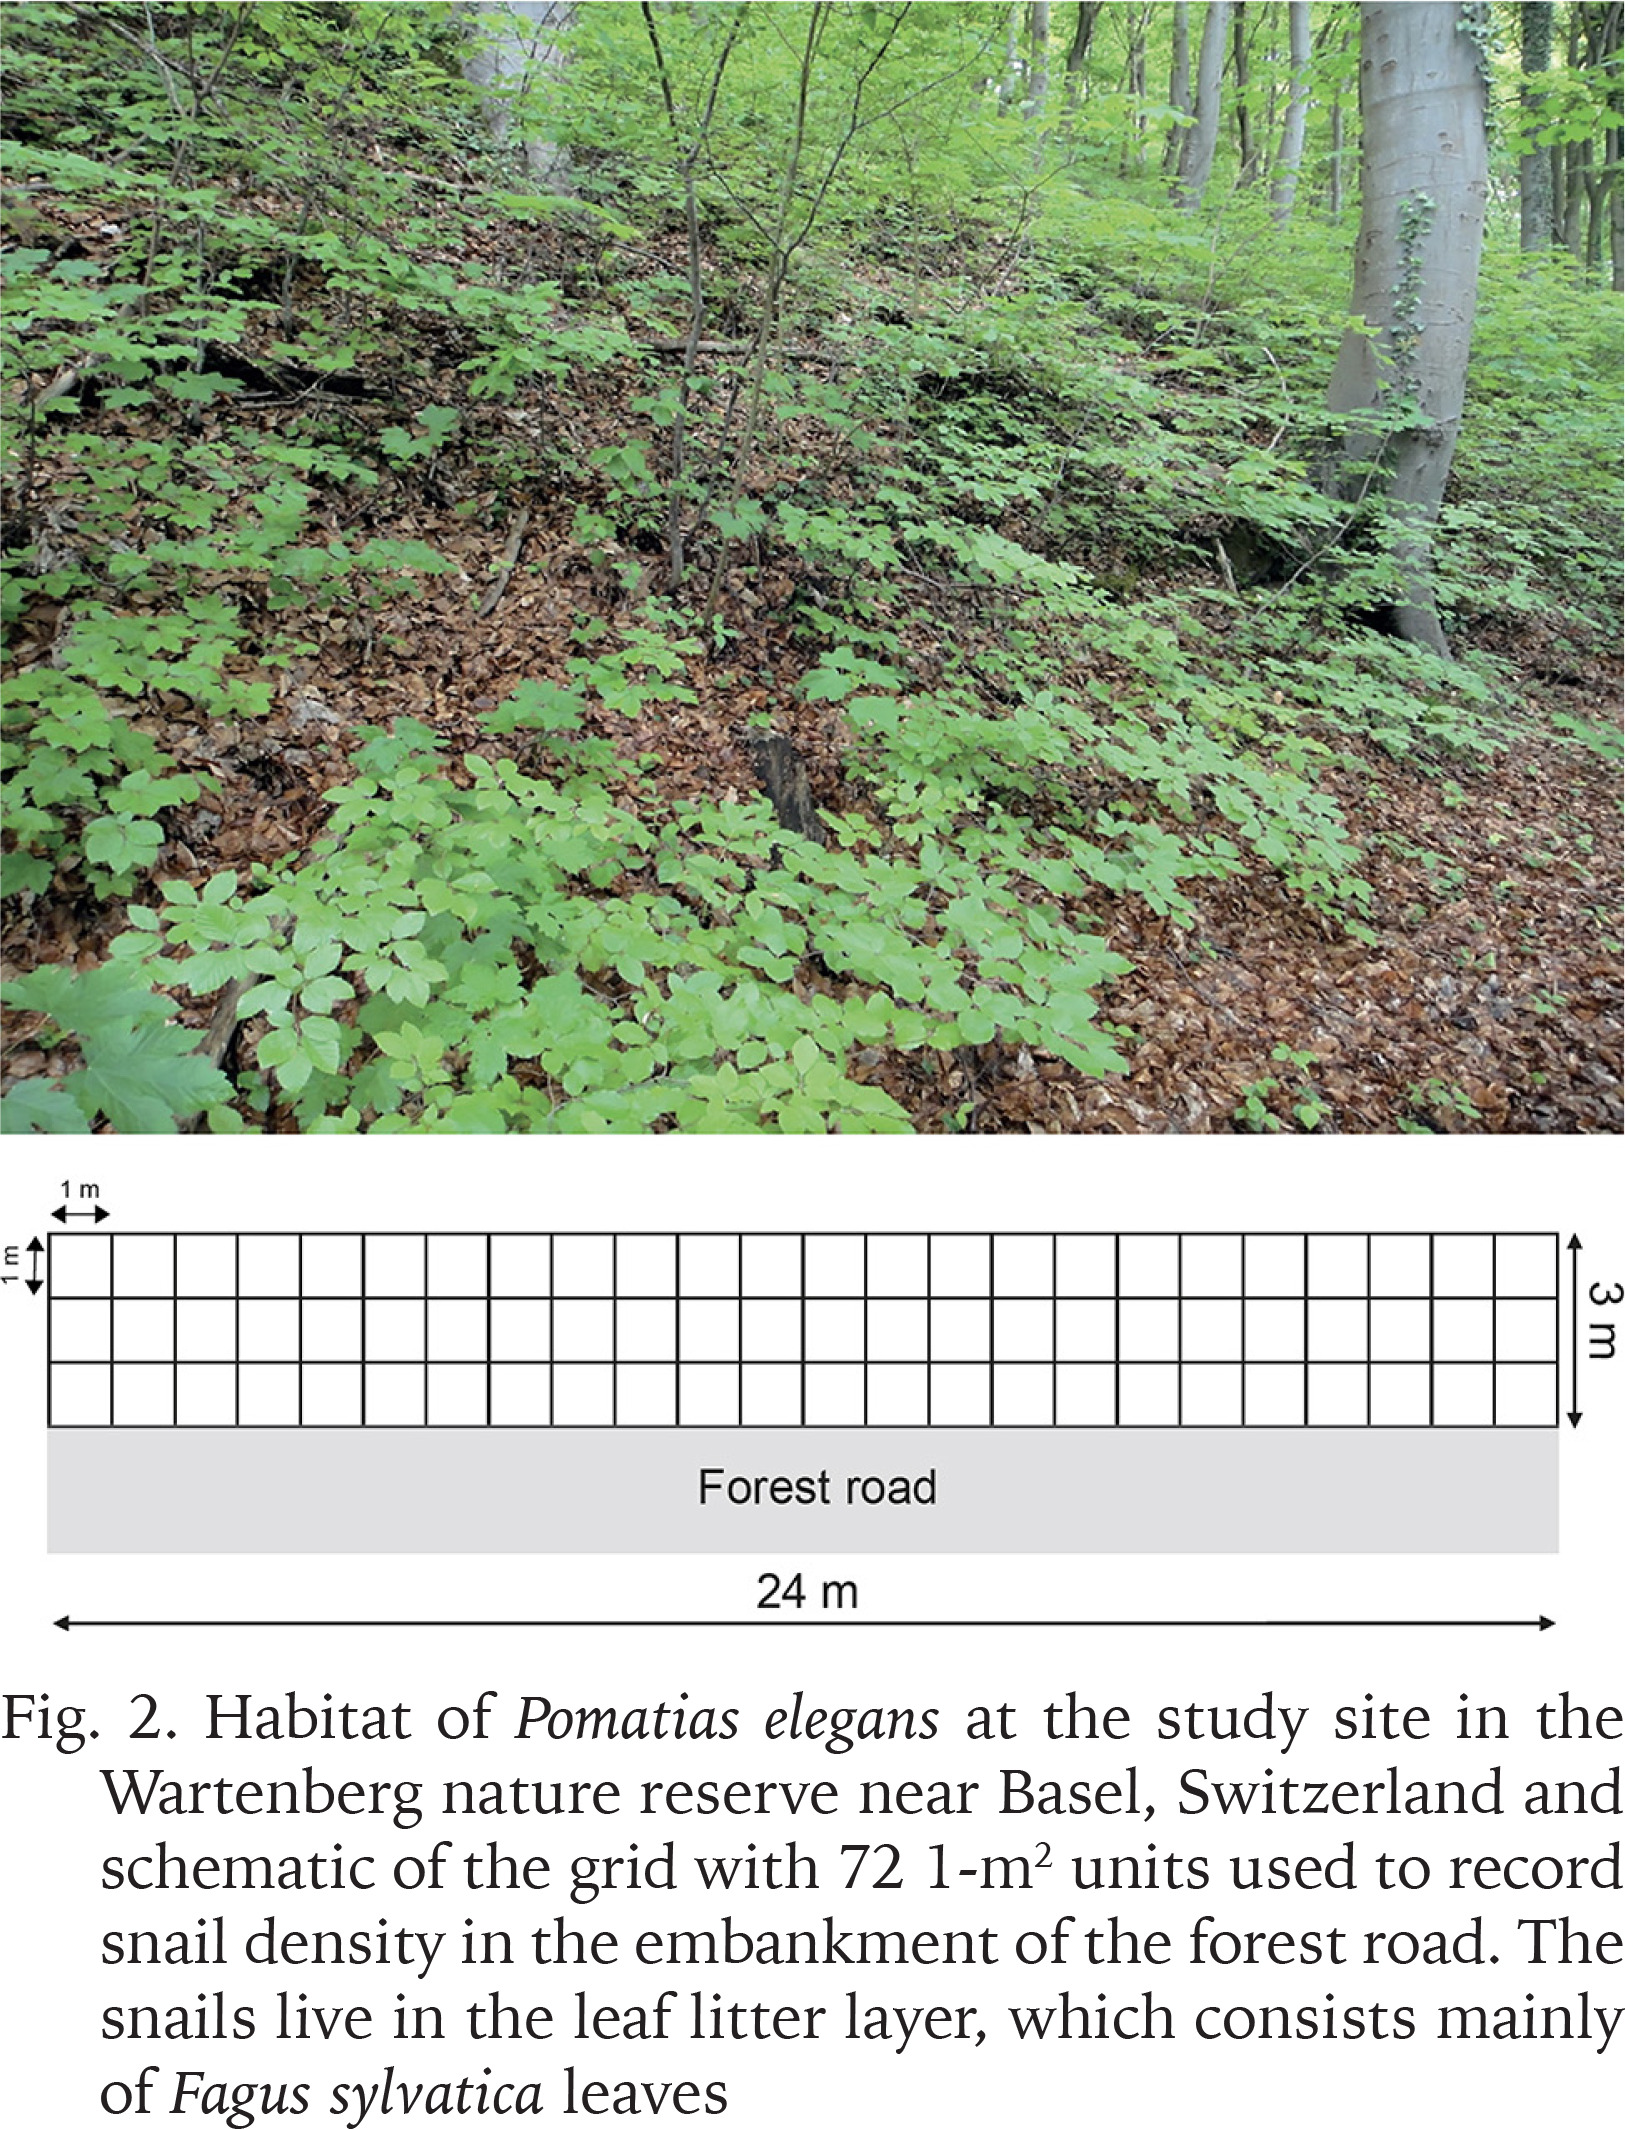
The monitoring took place over 15 years in the embankment (inclination 32°) of a 2-m wide forest road at an elevation of 390 m above sea level. We installed a grid consisting of 72 m2 (24 m × 3 m along the road) using cords (Fig. 2). The grid was set up at the same location every year from 2004–2007, but had to be moved 30 m to the southwest on the same embankment for subsequent years due to a wind throw.
Field work was carried out every year in May (2004–2007) or April (2008–2018) by a group of undergraduate students as part of a practical course in ecology (Table 1). In each 1-m2 grid unit, one person carefully searched the leaf litter for P. elegans for 10 minutes. The shell height of each snail found was measured to the nearest 0.1 mm using a Vernier caliper. There is little sexual dimorphism in P. elegans, with females being slightly taller and broader than males (Boycott 1909, 1917). However, the differences between the sexes are subtle and it is not possible to determine the sexes of individuals based on their shell size alone. In a sample of 295 snails, a canonical discriminant analysis revealed that 32% of males were classified as females and 37% of females were classified as males when sex was assessed on shell size alone (Jordaens et al. 2001). The snails must be dissected to clearly determine their sex. In our long-term study, we were not allowed to collect animals because the study site is located in a nature reserve and the snail is a Red List species. Furthermore, we did not want to affect the number of individuals. We therefore did not differentiate between the sexes.
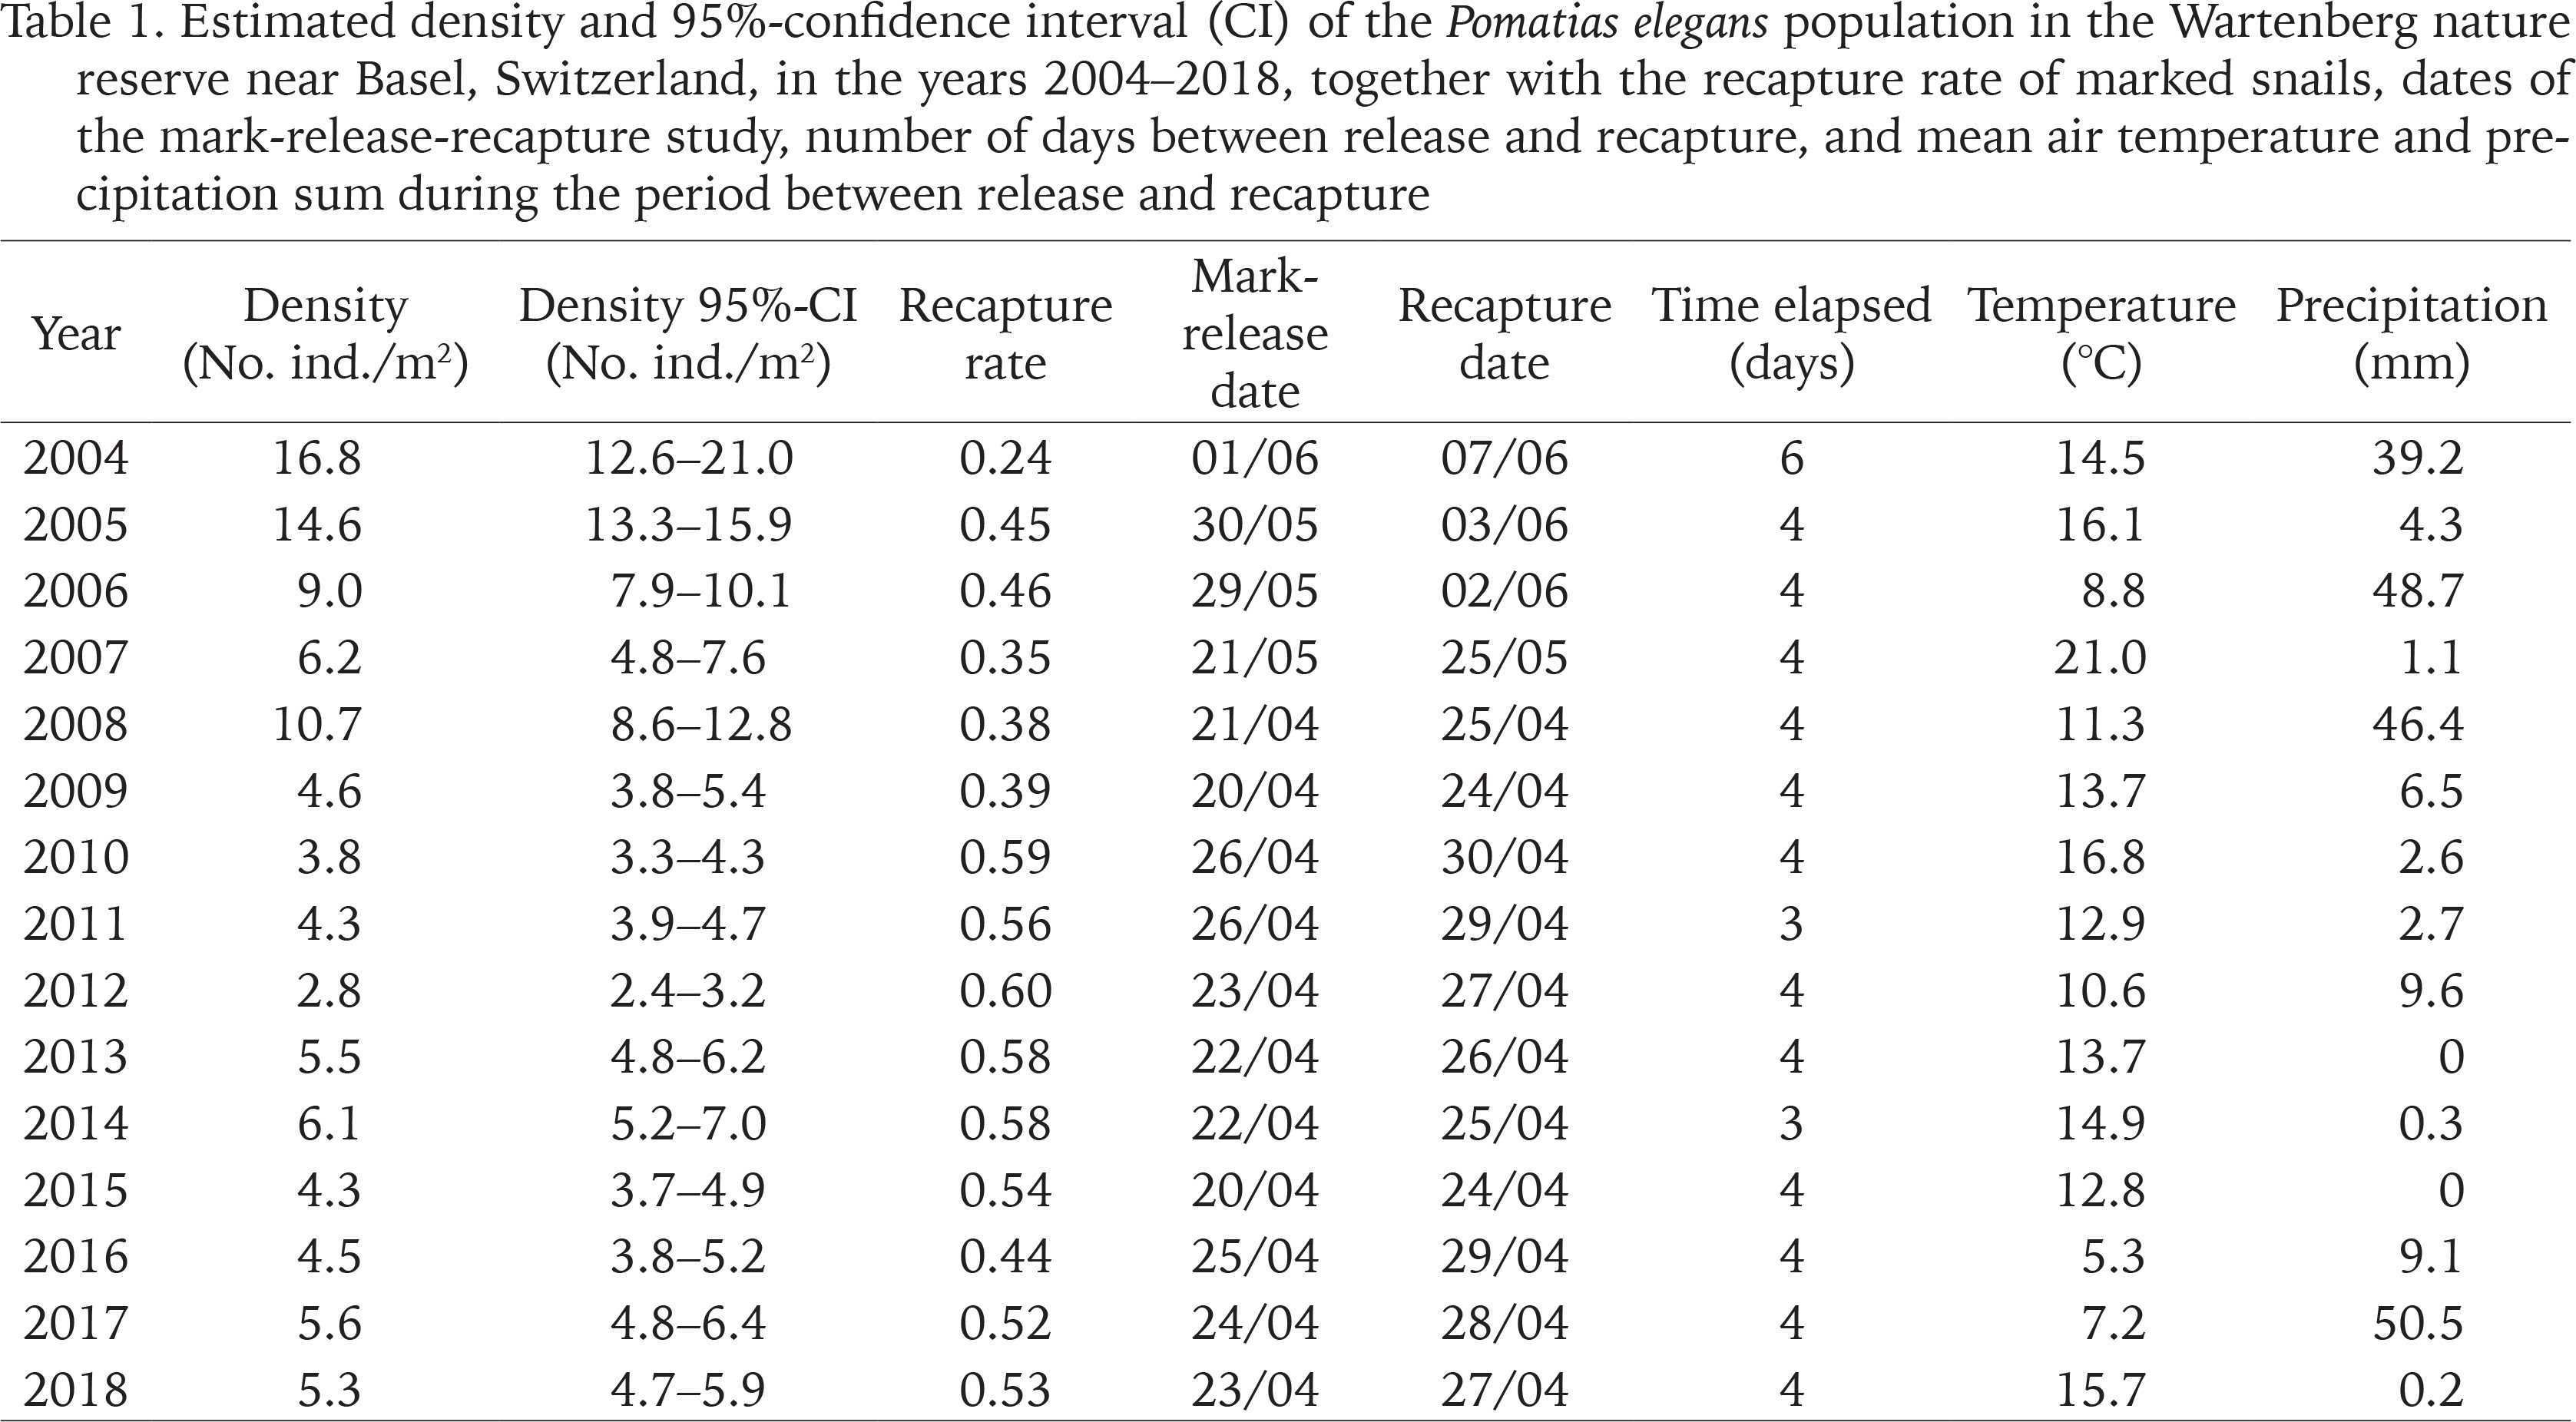
Table 1
Estimated density and 95%-confidence interval (CI) of the Pomatias elegans population in the Wartenberg nature reserve near Basel, Switzerland, in the years 2004–2018, together with the recapture rate of marked snails, dates of the mark-release-recapture study, number of days between release and recapture, and mean air temperature and precipitation sum during the period between release and recapture
Each snail was then marked on the last shell whorl with three tiny coloured dots using car lacquer (as described in Henry & Jarne 2005). A unique colour code was used for each 1-m2 unit (i.e. all snails found within 1 m2 received the same marking). Within an hour, the tagged snails were released in the centre of the 1-m2 unit in which they were found. The cord grid was left standing and 4 days later each 1-m2 unit was searched again by the same student for 10 minutes for marked and unmarked P. elegans. The numbers of marked and unmarked snails were recorded and all snails were released in the 1-m2 unit in which they were found. A total of 2,447 individuals were measured and marked over the 15 years. Because P. elegans is a perennial species, the capture in one year also included individuals that had already been found in previous years. However, the individuals have continued to grow over the years. Snails that were already found in previous years have been re-labelled with the colour code of the 1-m2 unit in which they were found again.
MICROHABITAT CHARACTERISTICS
To investigate whether microhabitat characteristics affected the population density of P. elegans and changed over the 15 years, we recorded the leaf litter cover (in % per m2, accuracy 5%), the thickness of the leaf litter layer (in cm; three measurements per 1-m2 unit) and the shrub cover (shrubs and young trees (mainly F. silvatica) up to 2 m in height, estimated by eye, in % per m2; accuracy 10%) in each 1-m2 unit. Microhabitat characteristics were measured immediately before the search for P. elegans in every year. Sampling units arranged in a grid are not independent of each other. To avoid spatial pseudoreplicates, we used means (n = 72) of each year for statistical analyses.
INDIVIDUAL GROWTH PATTERNS
Some previously marked snails were rediscovered in the following year. Using the clearly visible winter growth stop on their shells, we measured the shell height increase from the previous year. When these snails were found in April, they had not yet exhibited any shell growth that year. All measurements were taken between 2015 and 2018 by the same person (BB) using a Vernier caliper with an accuracy of 0.1 mm. In total, 69 marked snails were found across two consecutive years.
POPULATION DENSITY ESTIMATE
We used the mark-release-recapture data to estimate the annual population density in the study area. In each year, we counted the total number of snails found and marked (sum of all 72 1-m2 units) on the first day (r), the total number of snails found on the second day of the study (n) and the total number of marked animals (m) in the second sample. We calculated the recapture rate of marked snails on the second sampling occasion as m/r. Using Petersen’s model (Begon 1979), we estimated the actual number of snails in the study area as
and calculated the standard error (formula in Begon 1979). Since the entire population is spread over a much larger area in the forest reserve, we calculated the local population density: N/a, where a is the size of the study area in m2. This density estimate is based on the snails we found on two occasions.
TEMPERATURE AND PRECIPITATION DATA
To examine whether temperature and amount of precipitation affected the recapture rate of marked snails and estimates of population density during the study period (2004–2018), we used data on daily air temperature (measured at a height of 2 m) and daily precipitation sum from the Basel/Binningen weather station (distance to the study area 6 km) (www.meteoswiss.admin.ch). For our analyses, we calculated the average temperature and precipitation sum between the day of release and recapture (recapture rate analysis), as well as between the release in the previous year and the day of recapture in the following year (population density analysis).
STATISTICAL ANALYSES
We performed all statistical analyses in the R environment (R Core Team 2025). Due to the slight shift in the study area and the fact that field work was carried out 1 month earlier from 2008 onwards, we examined the possible effect using the factor “period” (2004–2007 vs. 2008–2018) in the following analyses. However, it should be noted that the influences of temporal and spatial changes cannot be separated in our study. We applied a linear mixed-effects model (LME) with random and fixed effects (lmer function) for normally distributed data implemented in the R package lme4 to assess potential effects on the recapture rate of P. elegans expressed in proportions (sqrt-transformed). In the LME analysis, period (2004–2007 vs. 2008–2018) was defined as random effect, while time elapsed between release and recapture, temperature, precipitation and the microhabitat characteristics leaf litter cover, thickness of leaf litter layer and shrub cover were all defined as fixed effects. Temperature and precipitation data from the time between release and recapture (4 days) were used in this analysis (Table 1). We used a similar LME to analyze the effects of period (random effect), temperature, precipitation, leaf litter cover, thickness of leaf litter layer and shrub cover (all fixed effects) on the density of P. elegans. The LME models were fitted using lmerTest in the R package. Temperature and precipitation data from the time between release in the previous year and recapture in the year of density estimation were used in this analysis. For thickness of leaf litter and shrub cover we have missing data in one or two years (Table 2).
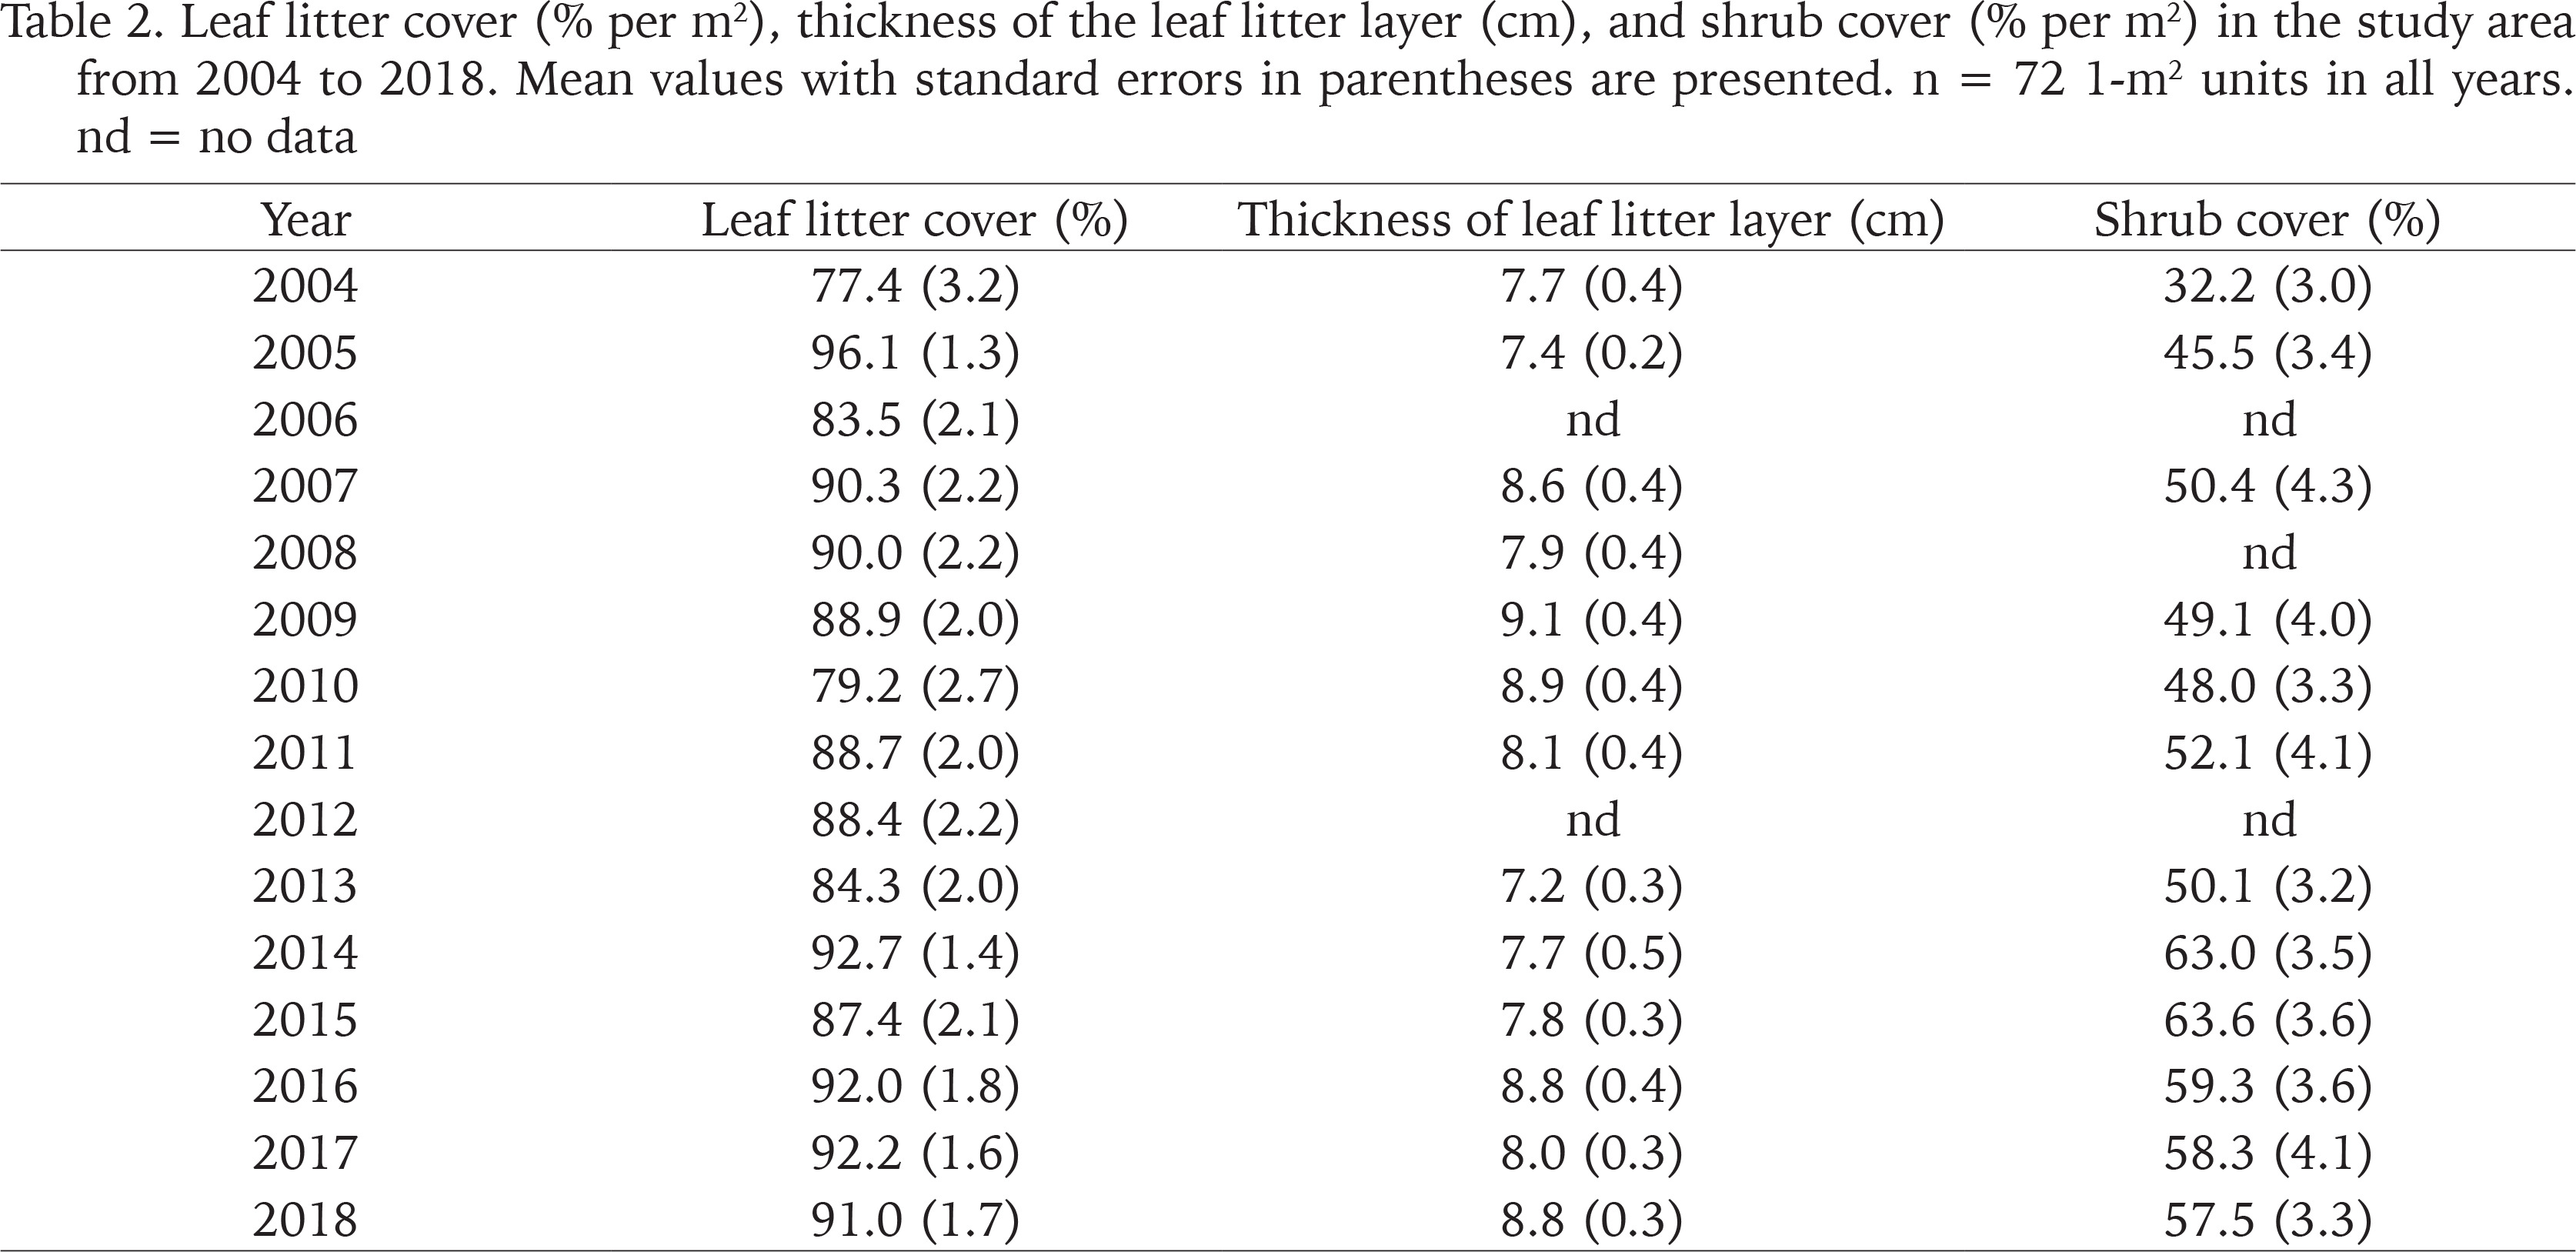
Table 2
Leaf litter cover (% per m2), thickness of the leaf litter layer (cm), and shrub cover (% per m2) in the study area from 2004 to 2018. Mean values with standard errors in parentheses are presented. n = 72 1-m2 units in all years. nd = no data
We assessed individual shell growth rates by measuring shell height increase in 1 year over three 1-year periods from April 2015 to April 2018. We used regression analysis to examine whether individual growth (log-transformed) depends on the shell size of the animal in each year. We used the R Package Hmisc to test whether the slopes of the three regression lines differ from each other. Similarly, the R package emmeans was used to test whether the intercepts of the three regression lines differ.
RESULTS
MICROHABITAT CHARACTERISTICS
Leaf litter covered on average 88.1% (range 77.4–96.1%) of the forest floor and the leaf litter layer was 8.2 cm (range 7.2–9.1 cm) thick (Table 2). Both litter cover and litter layer thickness showed no change over the 15-year study (Spearman rank correlation: rs = 0.336, n = 15, p = 0.21 and rs = 0.223, n = 13, p = 0.44). The shrub cover was more variable (mean: 51.3%, range 32.2–63.6%) and increased in the course of the study (rs = 0.727, n = 12, p = 0.0159), most probably due to the growth of the woody plants (Table 2).
Leaf litter cover did not differ between the periods 2004–2007 and 2008–2018 and therefore also did not differ between the two adjacent study areas (86.8% vs. 88.6%; Mann-Whitney U-test, z = −0.392, p = 0.70). Similarly, the thickness of the leaf litter layer did not differ beween the two periods (7.9 cm vs. 8.2 cm; z = −1.099, p = 0.27). However, shrub cover was slightly but not significantly lower in 2004–2007 than in 2008–2018 (42.7% vs. 54.1%; z = −1.757, p = 0.079).
RECAPTURE RATE
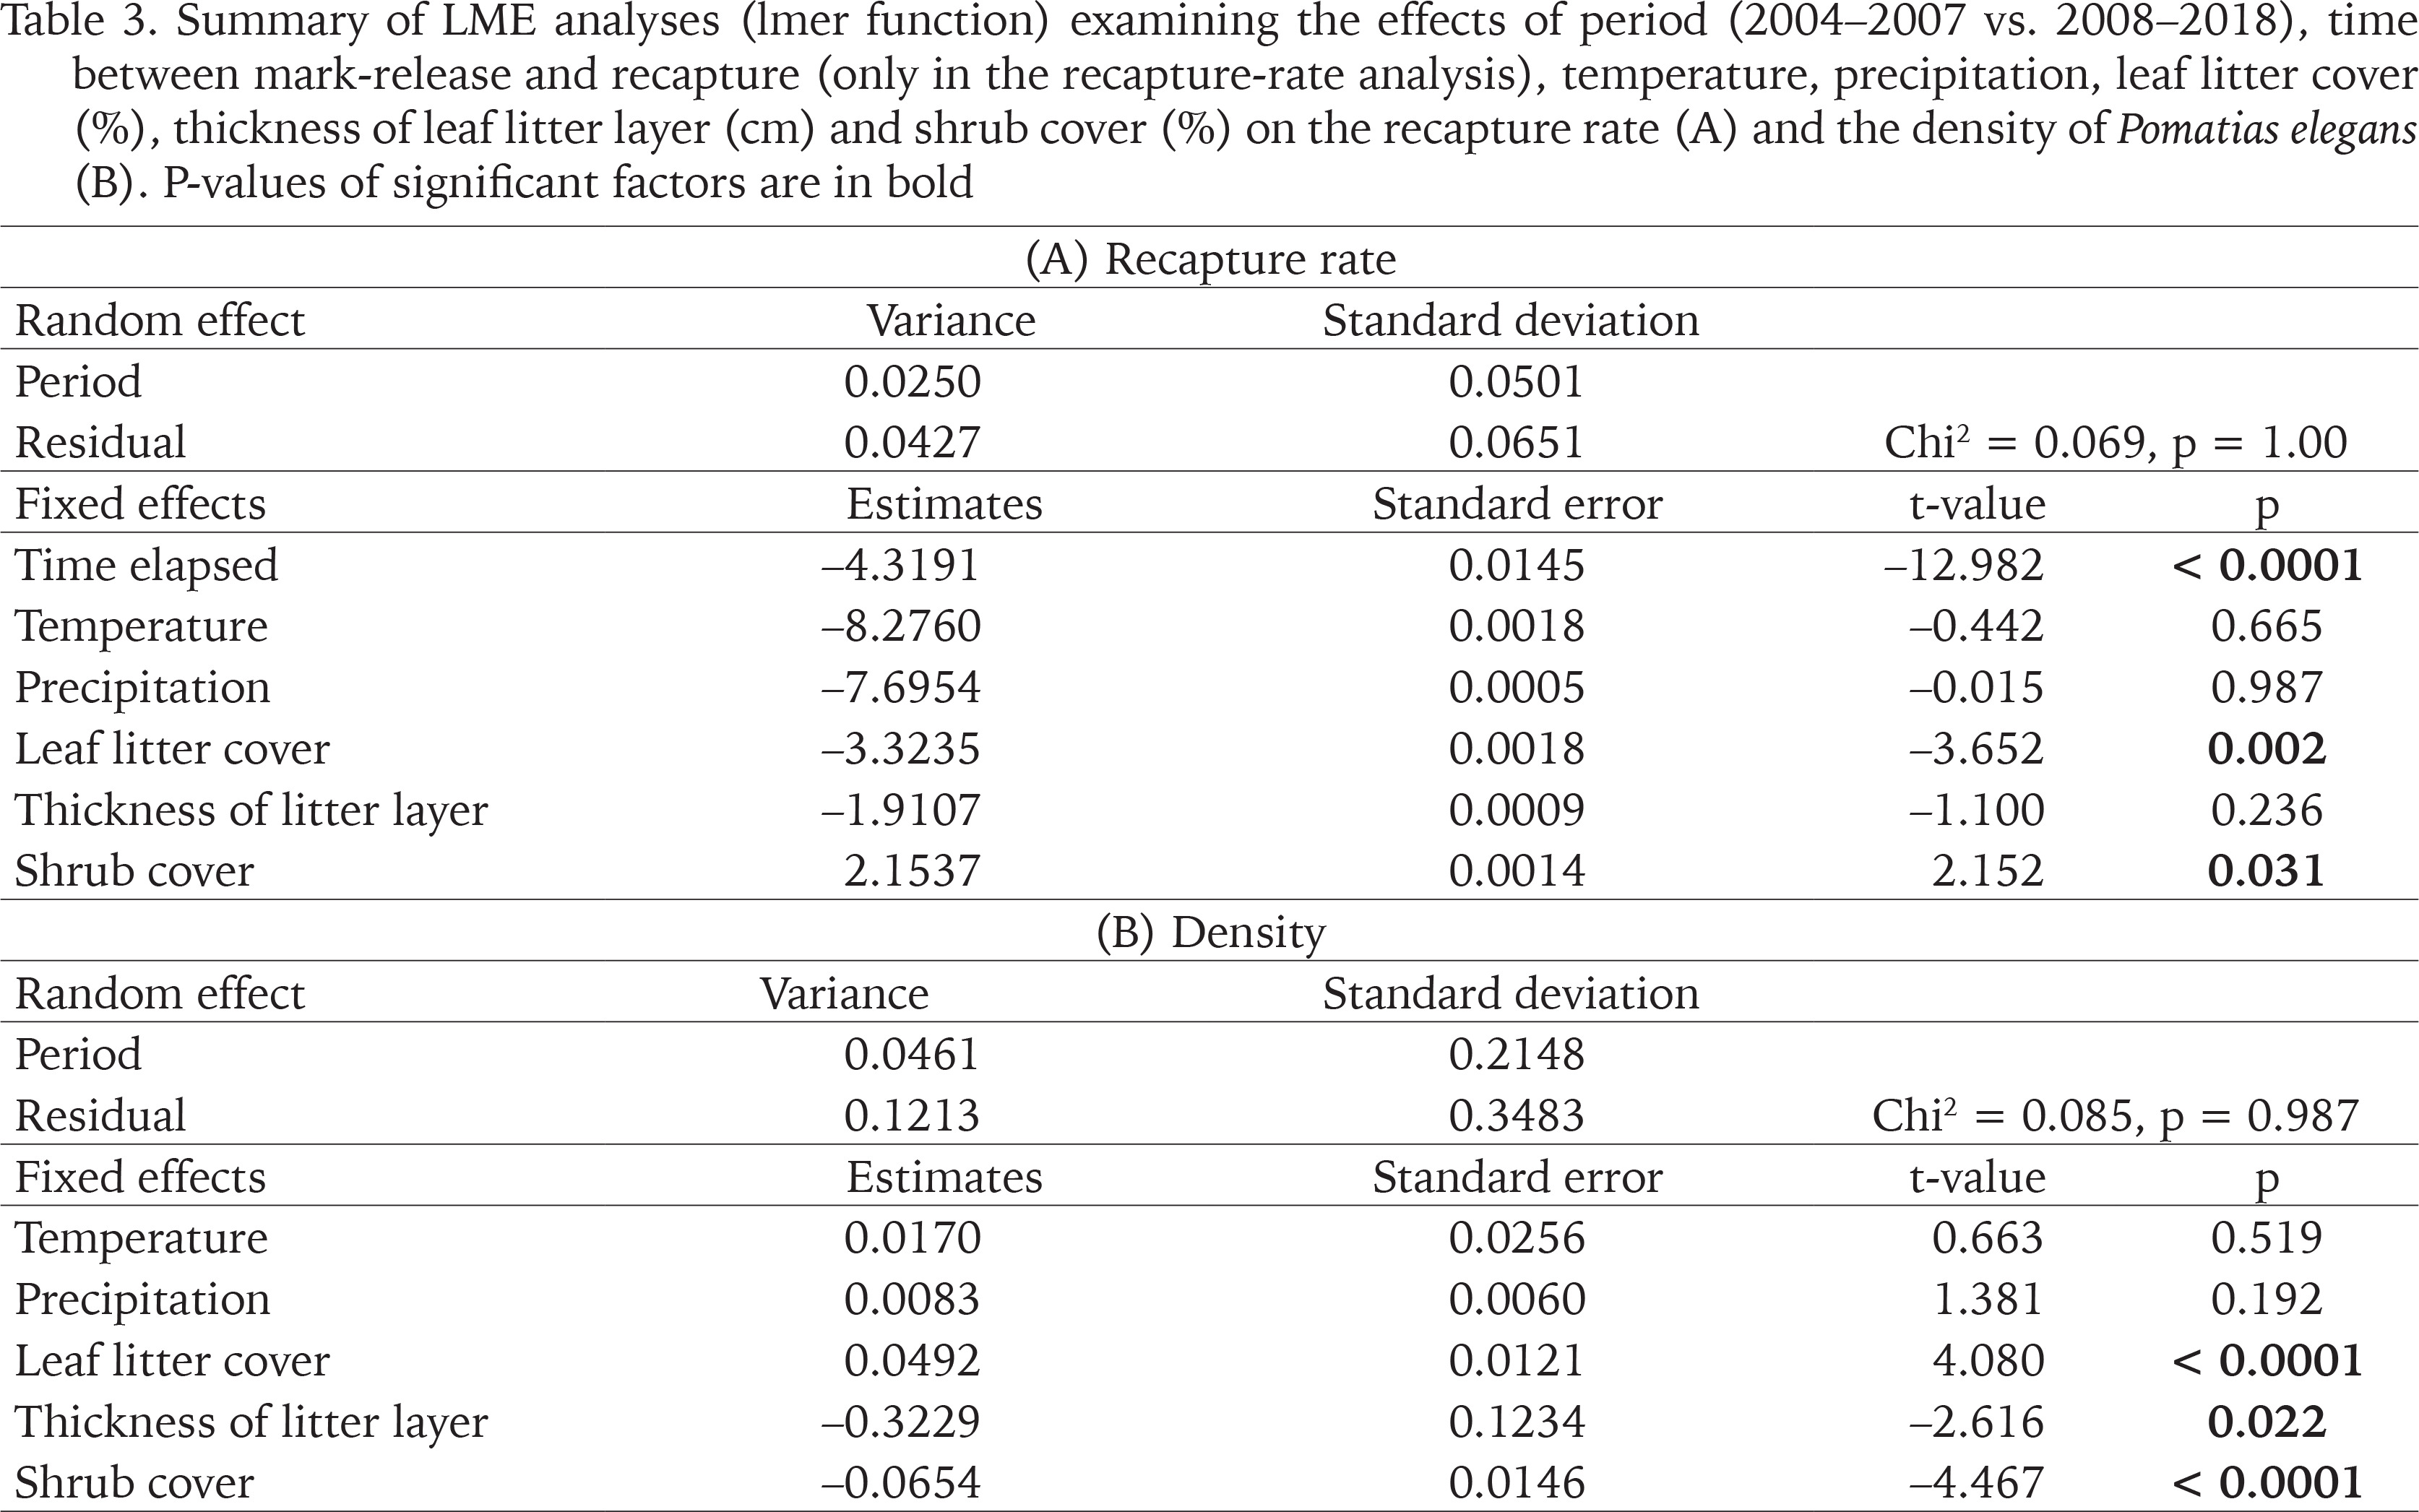
Recapture rate of marked P. elegans averaged 48.1% (range 24.0–60.0%; Table 1). LME-analysis revealed that the recapture rate was affected by the time elapsed between release and recapture, leaf litter cover, and shrub cover (Table 3). Leaf litter cover had a negative impact on the recapture rate: the greater the percentage of ground covered with leaves, the lower the recapture rate (Table 3). Shrub cover, on the other hand, had a positive influence on the recapture rate: the more sampling units were shaded by bushes, the higher the recapture rate (Table 3). The thickness of the leaf litter layer, the temperature between release and recapture, and the amount of precipitation do not appear to have an effect on the recapture rate of marked P. elegans (Table 3).
Table 3
Summary of LME analyses (lmer function) examining the effects of period (2004–2007 vs. 2008–2018), time between mark-release and recapture (only in the recapture-rate analysis), temperature, precipitation, leaf litter cover (%), thickness of leaf litter layer (cm) and shrub cover (%) on the recapture rate (A) and the density of Pomatias elegans (B). P-values of significant factors are in bold
POPULATION DENSITY
Population density of P. elegans averaged 6.9 individuals/m2 over the entire study period, with an annual fluctuation between 2.8 and 16.8 individuals/m2 (Table 1). LME-analysis showed that the population density was affected by the leaf litter cover, thickness of the leaf litter layer, and shrub cover (Table 3). Leaf litter cover had a positive impact on the population density: the greater the percentage of ground covered with leaves, the higher the population density (Table 3). In contrast, leaf layer thickness and shrub cover had a negative impact on the population density of P. elegans (Table 3). The deeper the leaf litter layer was and the more shrubs shaded the ground, the lower the population density. The average temperature between two consecutive sampling years and the amount of precipitation in that period do not seem to have any influence on the population density (Table 3). Interactions between the factors also had no influence on population size (data not shown).
SHELL SIZE DISTRIBUTIONS AND INDIVIDUAL GROWTH PATTERNS
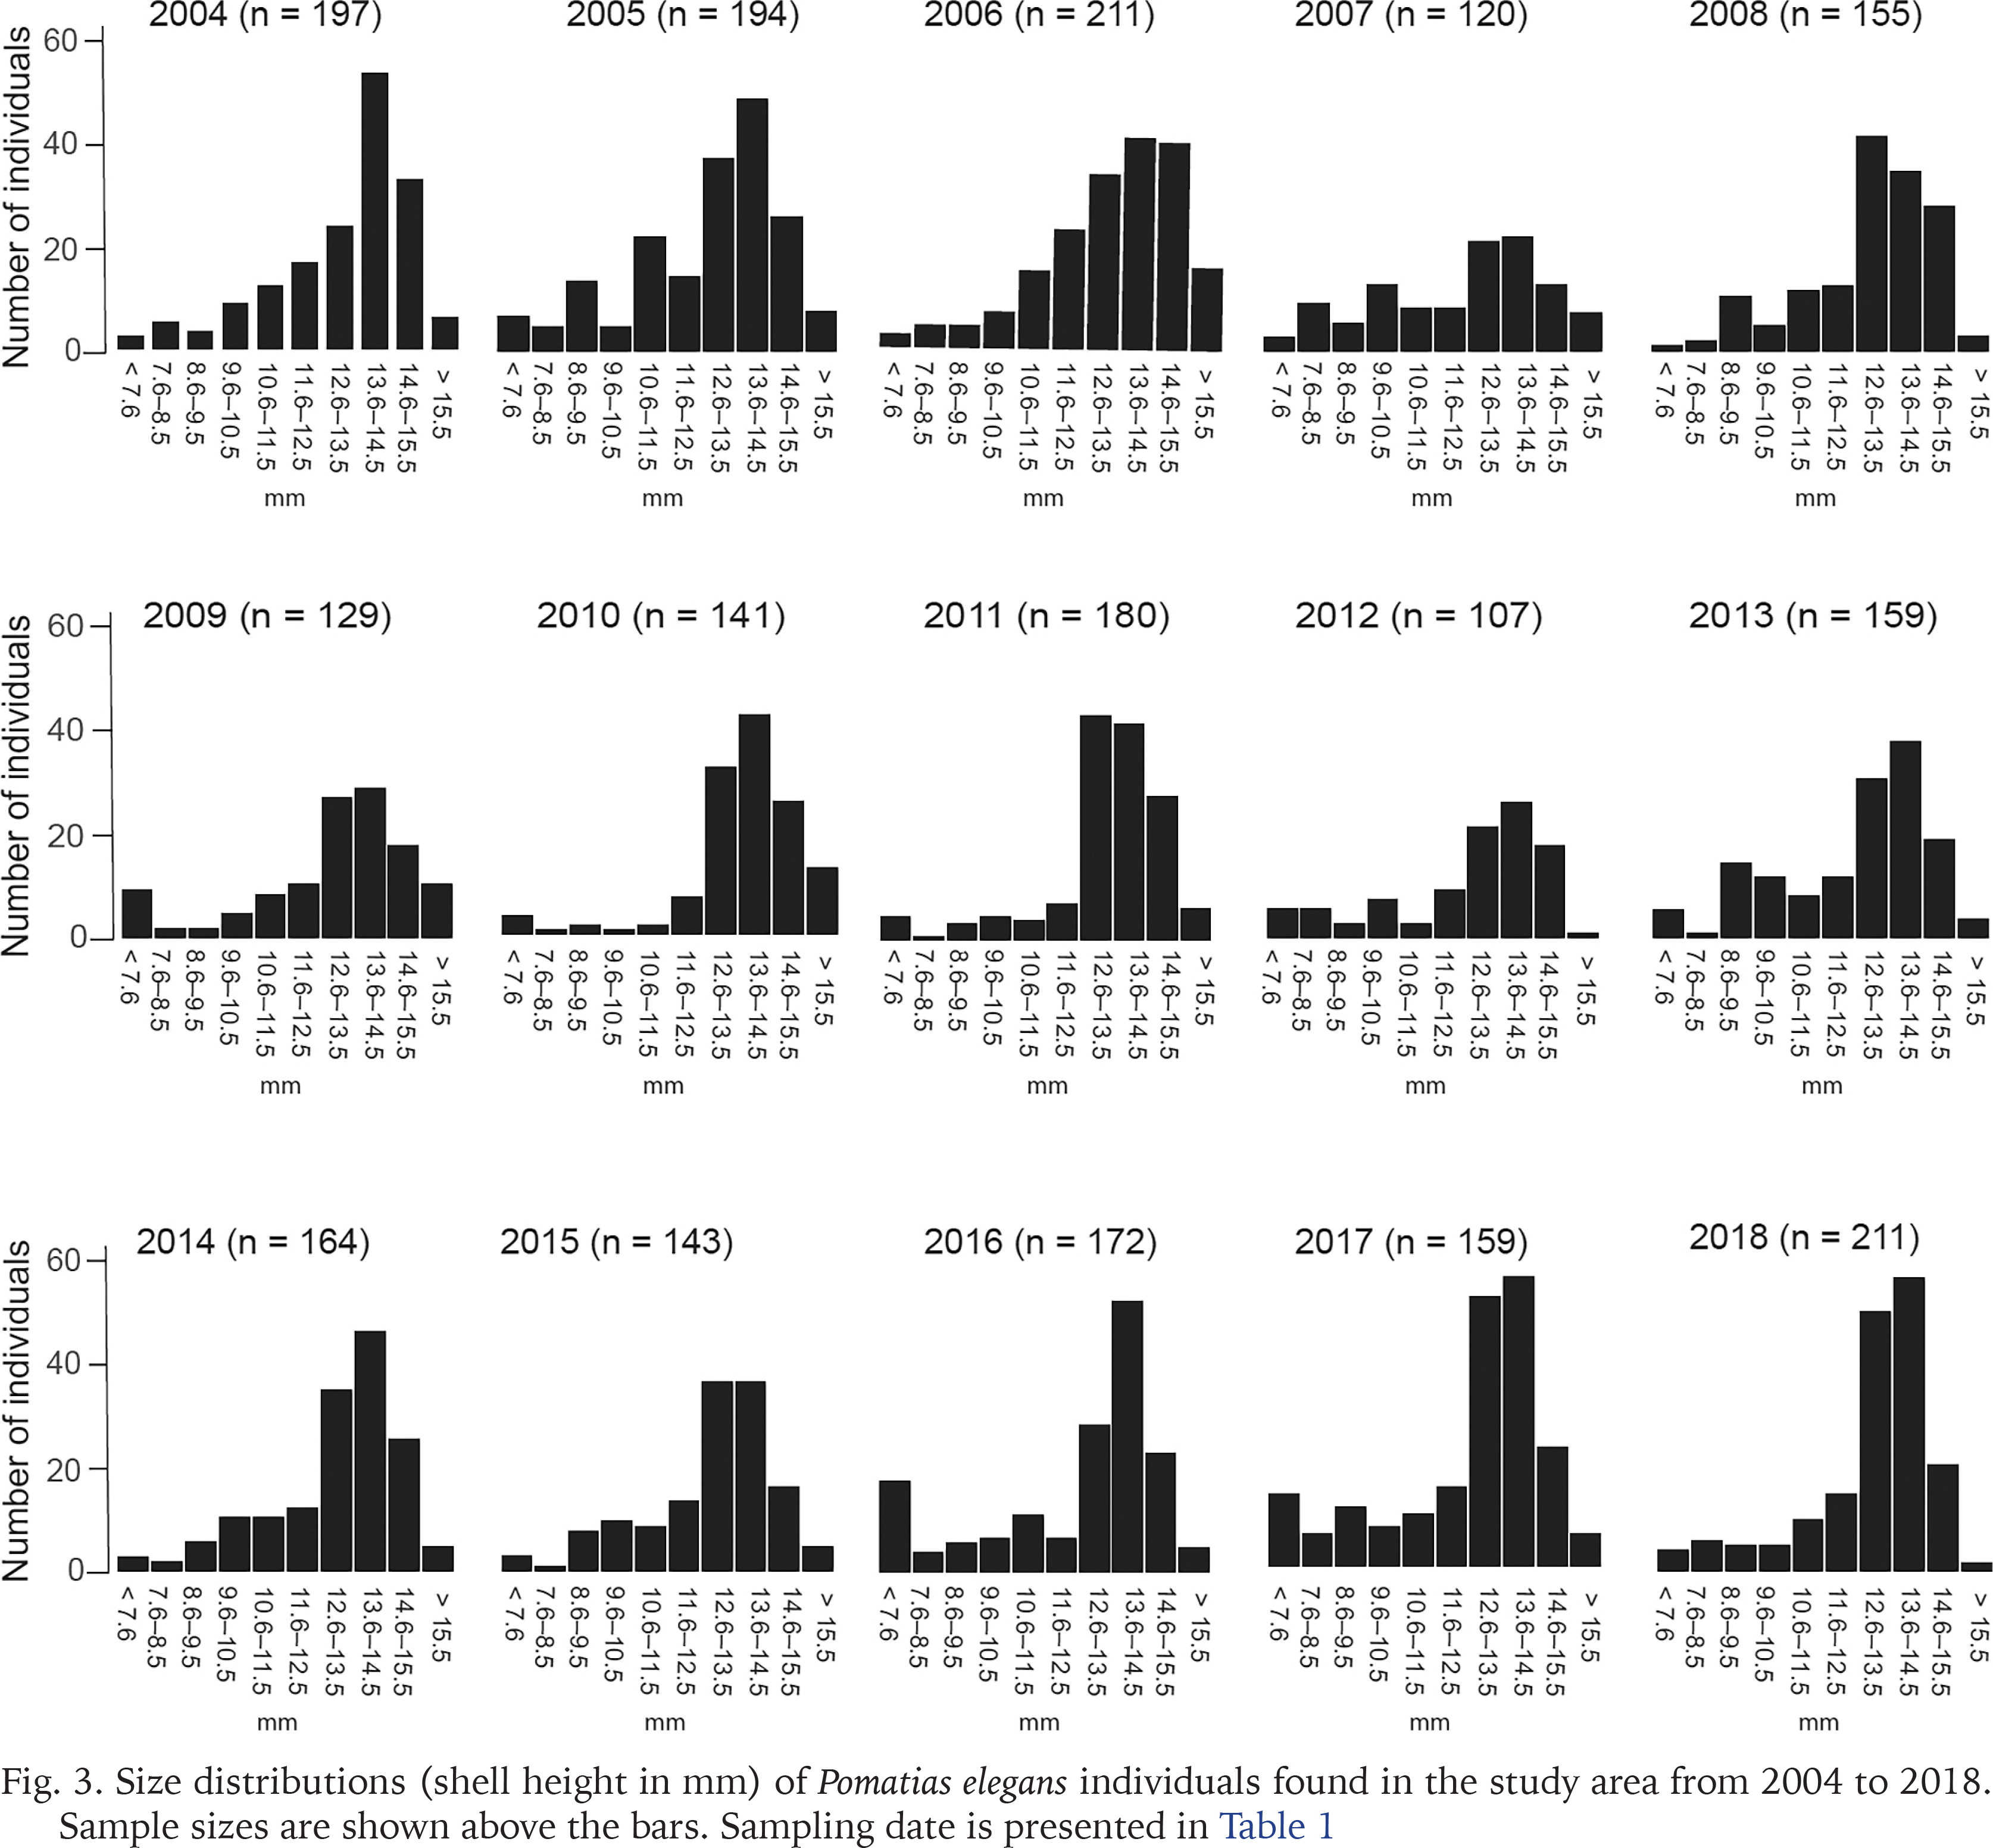
The smallest P. elegans individual we found had a shell height of 4.0 mm, the largest individual measured 16.5 mm (Fig. 3). The proportion of snails that had a shell height of less than 7.6 mm varied from 0.6% to 11.0% (mean = 4.0%) of the animals found over the 15 years (Fig. 3). If one takes into account that hatchling size of P. elegans is 2 mm, then the juveniles and young snails are missing or are severely underrepresented in the samples found.
Fig. 3
Size distributions (shell height in mm) of Pomatias elegans individuals found in the study area from 2004 to 2018. Sample sizes are shown above the bars. Sampling date is presented in Table 1
Marked individuals that were refound in the following year varied in shell growth rate (Fig. 4). Shell growth within 1 year (sgr) was influenced by snail size (sh): small snails grew faster than large individuals (Fig. 4). Regression analyses showed that this relationship was significant in all three years examined (Fig. 4). The regression lines for the three years did not differ in slope (p > 0.35 in each comparison) and intercept (p > 0.28 in each comparison). This indicates that the shell growth rate did not differ over the three years. Thus, the total linear regression line (data from all years combined) is sgr = −0.167sh + 2.670, r2 = 0.470, df = 67, p < 0.0001.
Fig. 4
Shell growth rates (increase in shell height within 1 year in mm) of Pomatias elegans individuals in a natural population over three 1-year periods (from April to April). Sample sizes are n = 20 in 2015–2016, n = 15 in 2016–2017, and n = 34 in 2017–2018. Linear regression lines for the relationship between shell growth rate (srg) and shell height (sh) are for 2015–2016: sgr = −0.116sh + 2.011, r2 = 0.397, df = 18, p = 0.0029; 2016–2017: sgr = −0.205sh + 3.26, r2 = 0.651, df = 13, p = 0.0003; and 2017–2018: sgr = −0.168sh + 2.613, r2 = 0.428, df = 32, p = 0.0001
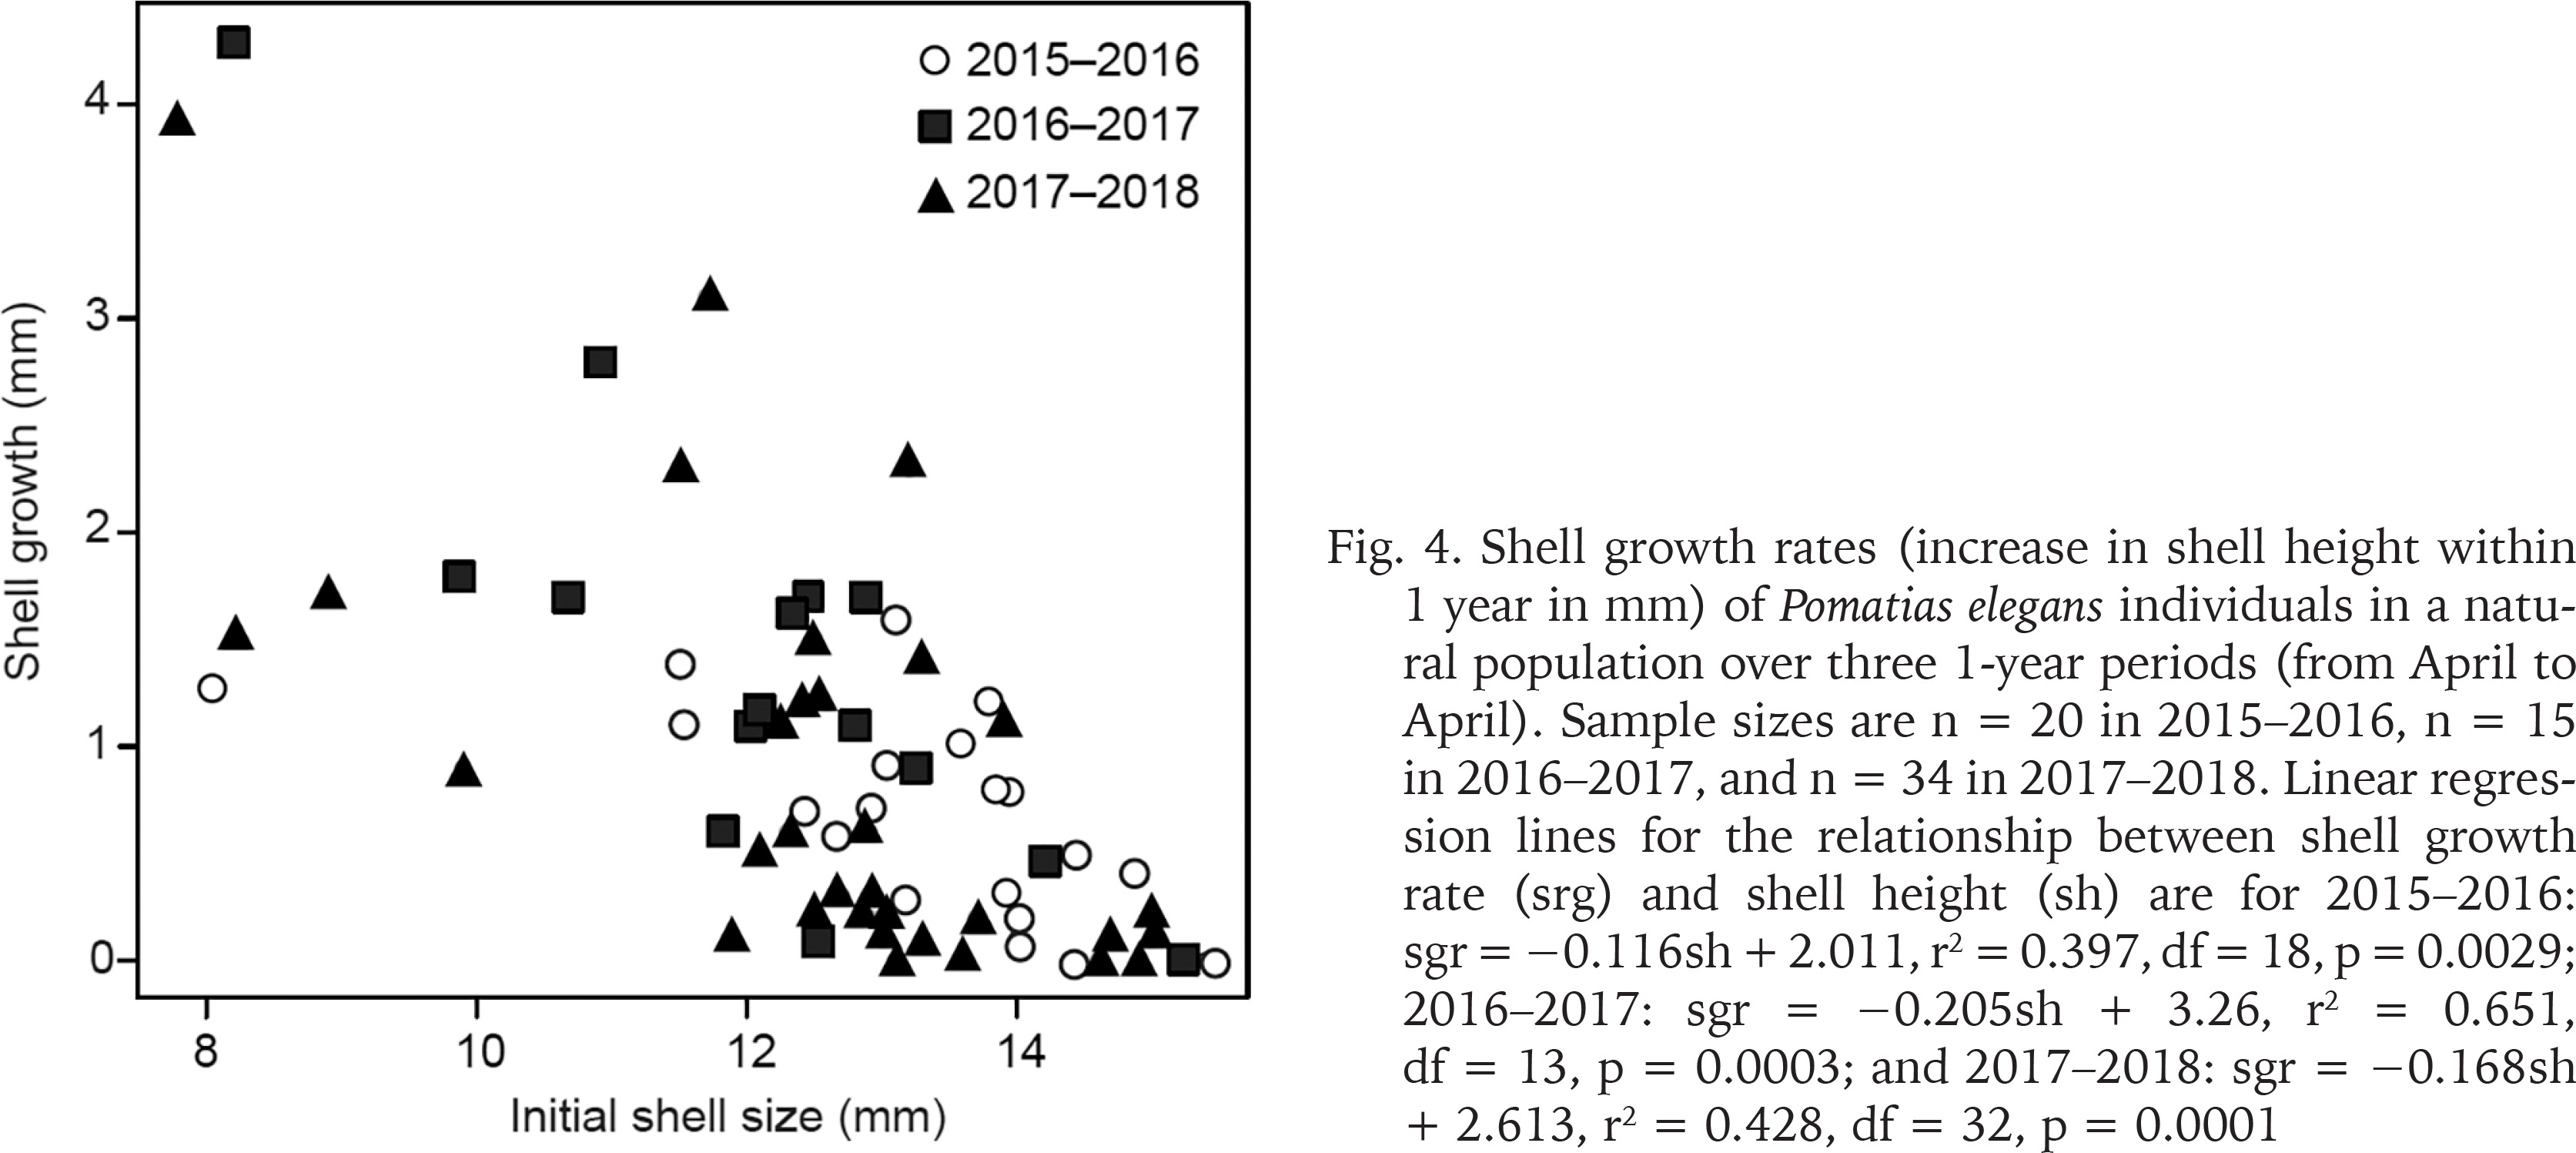
As the shell size increases, a larger proportion of snails no longer show any growth (Fig. 4). This suggests that most snails with a shell height > 14 mm are reproductively active.
DISCUSSION
POPULATION DENSITY
For P. elegans, leaf litter cover, thickness of the litter layer, and shrub cover could be important factors affecting habitat quality. In our study, leaf litter cover and thickness of the leaf litter layer showed little variation between years and did not change over the 15 years. In contrast, shrub cover showed a trend of increasing over the 15 years. Leaf litter cover combined with litter layer thickness can be viewed as the amount of available food resources for P. elegans. Every autumn a new layer of fallen leaves is added. The annual leaf litter production in a F. sylvatica forest in central Germany was 277 g/m2 (Eickenscheidt & Brumme 2013). Together with microorganisms and other detritivores such as earthworms, woodlice, millipedes, mites and other snails, P. elegans contributes to the decomposition of the accumulating leaf litter so that approximately the same amount is always present in summer (Mason 1970). Our study showed that the three habitat characteristics can have an influence on the population density and the recapture rate in the mark-release-recapture method.
During our 15-year study, the overall population density of P. elegans fluctuated from 2.8 to 16.8 individuals per m2. The estimated population density in each year was significantly lower than the maximum value of 80 P. elegans individuals per m2 reported by Kilian (1951). However, it is not known how Kilian (1951) determined the population density. Maybe it was just a single observation. Pfenninger (2002) sampled aggregated individuals of P. elegans in small quadrats in various woody and shrub habitats in southern France and extrapolated his counts to 1-m2 units. These relative maximum densities cannot be directly compared to the densities in our study. However, Pfenninger’s (2002) data indicate that densities of P. elegans in the species’ main range are higher than in our population, which is located at the edge of the species’ distribution area.
In our study, population density was positively affected by leaf litter cover. Leaf litter cover averaged 88.1% in the study area. In general, the forest floor was covered with fallen leaves (Fig. 2). In some 1-m2 units there were trees whose trunks took up part of the area. There were also a few stones in some units. It is obvious that due to the reduced leaf cover in these units there were also fewer snails.
Population density was also negatively influenced by the thickness of leaf litter layer and shrub cover. Pomatias elegans is a thermophilous and drought-tolerant species common in hedge banks and open woods (Kerney 1999). A thicker leaf litter layer retains more moisture than a thin layer and makes it harder for snails to access loose soil to burrow. An increasing shrub cover reduces direct radiation and reduces temperature, and retains more moisture in the leaf litter layer (Stoutjesdijk & Barkman 1992). Both a thickening leaf layer and an overgrowing shrub layer can therefore reduce the habitat quality of P. elegans. However, this hypothesis should be tested in populations at different locations.
RECAPTURE RATE AND MARK-RELEASE RECAPTURE METHODS
In our study, the recapture rate of marked P. elegans individuals was affected by the factors time elapsed between release and recapture, leaf litter cover, and shrub cover. The recapture rate decreased as the number of days between release and recapture increased. It is possible that after a period of activity of a few days in the leaf litter, the snails will burrow again in the soil. It would be very interesting to equip P. elegans with individual sensors to record their activity in the leaf litter layer and resting times in the soil. In addition, the recapture rate was negatively affected by the increasing leaf litter cover. A possible explanation for this is that students who searched for snails in a large amount of leaf litter in a 1-m2 unit found a lower proportion of animals than in units with a smaller amount of leaf litter.
At any time of the year, some of the P. elegans individuals stay buried in the soil (Cook 2001). This points to an inherent problem with population density estimates in leaf litter-dwelling snails. During our standardised search for P. elegans we repeatedly found individuals of the co-existing Cochlostoma septemspirale (Razoumowsky, 1789) with a shell size of 3–7 mm. However, we never found a juvenile P. elegans of very small size (shell height < 4 mm). This suggests that we have not simply overlooked the juvenile P. elegans, but that they live predominantly in the soil.
For helicid snails in Western Europe, the proportion of active individuals depends on the season and time of day, the current weather conditions and the weather of the previous days (Cain & Currey 1968, Cameron 1973, Williamson et al. 1977). These factors influence the proportion of snails found in a survey out of the total number of animals in the population. Similar information is hardly available for other land snail species in forests and open areas in Europe. In a single survey of small areas, Cain & Currey (1968) estimated that they found 50% of adult Cepaea nemoralis (Linnaeus, 1758) on mild mornings. Using a mark-release-recapture method, Baur (1986) found that the recapture rate of marked subadult and adult Arianta arbustorum (Linnaeus, 1758) varied between 23 and 40% after 1 day, and was lowest after days of high humidity. These values are in the range of the recapture rate of marked P. elegans (24–59%) found in our study. Pomatias elegans is a slightly smaller species, but has a relatively high detectability in the leaf litter of forests (Albano et al. 2015).
The temporally variable proportion of individuals buried in the soil makes it difficult to record the density in P. elegans populations. Counting snails once in a sampling area is likely to result in an inaccurate population density estimate in this species. Mark-release-recapture techniques are expected to produce more precise estimates of population density, provided that various assumptions are met (Henderson & Southwood 2016). The Petersen model we used is based on the following assumptions: (1) no marks are lost between release and recapture; (2) marked animals do not have an increased chance of being recaptured; (3) handling and marking have no influence on the individual’s probability of survival; and (4) there are no deaths, births, and no snails that leave or enter the study area between release and recapture (Begon 1979). We marked the snails with three tiny car lacquer dots on the last whorl of the shell. We never observed any of the three points on a shell being lost during the 4 days between release and recapture. The coloured dots were so small that only after a snail was found could it be determined whether it was marked or not. When a P. elegans is touched, the animal immediately retreats into its shell and closes the aperture with its operculum. Handling and marking are unlikely to influence the snail’s probability of survival over this short period of time. The first three assumptions are therefore likely to be fulfilled. In the 4 days between the two sampling occasions there were no births and probably no (or very few) deaths. During the 15-year study period, we did not find any predated shells of P. elegans with typical feeding traces of carabid beetles or rodents (Brandmayr & Zetto Brandmayr 1986, Němec & Horsák 2019, Baur et al. 2023). The number of snails that had left the investigation area must be very low as more than 90% of the marked snails were found in their original 1-m2 grid unit and the remainder were mostly found in an adjacent grid unit. However, the number of unmarked P. elegans that returned from the soil to the litter layer (considered as immigrants in the model) and the number of marked individuals that entered the soil (considered as emigrants) between the two sampling occasions is likely to represent a larger source of error (the extent of which is unknown).
Nevertheless, mark-release-recapture methods appear to be the best approach for density estimation in leaf-litter-dwelling snail species such as P. elegans. By repeatedly searching the marked snails and using individual codes, even better estimates could be obtained with more complex models (Henderson & Southwood 2016). However, each search involves digging through the leaf litter, causing significant disruption to the microhabitat. This in turn can lead to increased snail mortality, reduced reproduction and a larger number of snails leaving the study area. We determined the density of P. elegans in a nature reserve and tried to keep the impact on the microhabitat (leaf litter layer) and the snails as low as possible. We therefore did not conduct repeated recaptures in the same year.
INDIVIDUAL GROWTH PATTERNS
Our repeated measurements on the same individuals showed that the growth rate in P. elegans is initially rapid and becomes progressively slower as the snails increase in size. In snails >14 mm, a increasing proportion of individuals no longer showed any growth (Fig. 4). These snails are likely to be reproductively active. By combining the individual shell growth of snails of different sizes, the following picture emerges. Juveniles of P. elegans are likely to reach a shell height of 5–7 mm in the first year of life and up to 12 mm in the second year of life. Then the shell growth slows down and the reproductive organs are developed. In the third year of life, P. elegans becomes sexually mature and begins to reproduce. In this phase of life the shell still grows very slowly and soon stops growing at all.
Within each snail population there is a large variation in individual growth patterns (Oosterhoff 1977, Baur 1984). Additionally, abiotic factors such as temperature and precipitation can influence the growth rates of snails in a population (Oosterhoff 1977). We do not know the months in which the main shell growth of P. elegans occurs. As a Mediterranean species, P. elegans estivates during hot and dry months (Fechter & Falkner 1990). There will be no shell growth during winter (hibernation) and dry periods.
CONCLUSIONS
Long-term field studies are often influenced by events beyond the control of the researchers. In our study, a wind throw in the winter of 2007/2008 made it impossible to continue working on a few square metres of the original study area, which made it necessary to move the grid slightly. At the same time, the biology curriculum at the university was changed, resulting in the ecology course being postponed by one month. Finally, the COVID-19 pandemic led to the long-term study being stopped, as only distance learning was possible for students in 2019. Nevertheless, our long-term field study yielded interesting findings that cannot be obtained in short-term studies. Our study also shows that classes of students can collect valuable data in long-term projects, provided that the tasks are not too difficult and that they are well supervised. In our project, the snail species was easy to identify and the individual work steps were clearly described. Measurements that require a high level of precision (individual shell growth) were carried out by an experienced person.
Our study showed that the population density of P. elegans was positively influenced by the percentage of ground covered with leaves, but negatively affected by increasing thickness of the leaf litter layer and increasing shrub cover. The latter is of particular importance for the protection of this endangered snail species in Switzerland. The known populations of P. elegans in Switzerland occur predominantly in hedgerows, on forest edges and in open forest. If the shrub cover becomes even denser in the population examined, the habitat quality for P. elegans deteriorates and the population size decreases. We therefore recommend that P. elegans be considered a target species in this nature reserve. Accordingly, maintenance measures such as thinning the forest in the nature reserve should be carried out at adequate intervals.